Profil | 
Profil Facebook A Kurnia Putra

Once you become somewhat familiar with how the forex market works, and you understand to a point what is involved in trading on the Foreign Exchange Market, you would want to start to gauge market trends in order to profit from your business ventures on the open market.

The name of the game is statistics, and the first rule is that you must be aware there is no such thing as a sure thing on the forex market. While you can never be 100% sure at any given time of the next move that will be made on the market as a whole, being able to read statistics and interpret them will place you ahead of the pack in regards to "guessing" what will happen next.

Forex trading is a lot like gambling. If you can keep track of the cards that have already been played, you are more informed, statistically, regarding what is likely to be dealt next, meaning you can place a bet with greater insight than someone who has no clue what has already been played. With the forex market, if you have information as to what has already occurred over the past few days, months, or even years, you are again placed in a better position to more logically conclude what will happen next. You simply learn the pattern and follow it to the end, reaping the financial rewards.

Charts And Chartists

Wait, did you think you were going to have to research and map out the market's past all by yourself? Of course not! There are people who get paid to do that sort of work. They monitor the market hourly, daily, weekly, monthly, and yearly so that they can provide big-time traders with the same knowledge mentioned before. The more a trading company knows about the market, the more money they can make.

The best part of this is that you have access to the same information as these VIP clients. Chartists, who are essentially market analysts that publish their findings in easy to read charts, produce what is referred to as a candlestick charts. These charts are basically a combination of a line graph and a bar graph that show the trend of various stocks, indexes, or other interests over a specified period of time. Therefore, you can easily determine if the currency is on an uptrend or if it is taking a downturn, when the last major change occurred, and how long it is predicted that the currency pair will continue on the current path.

If your broker does not supply you with these charts, then you should easily be able to draw them yourself with the modern day charting software or trading platform that you get from your broker. These software platforms can draw most charts for you by entering a couple of parameters and viewing the result.

It is recommended however that you learn at least the basics of charting and statistics before you start trading live.

If you want learning invest online in forex you can contact me at : +62 22 76771369

PUTRA DHASHA NETWORK: How To Make A Living As A Day Trader

Invest in Forex Automated Trading Software

Forex automated trading software can help anyone, regardless of where they are in their forex career. Newer traders are more likely to consider it than a trader who has been trading for years and gotten set in their ways. I'll even see this in my friends who have been trading for a couple of years more than I have. They believe they've learned all they can about the market and are happy with their rut. I enjoy being every bit as successful as they are while doing a fraction of the work. If you're still on the fence as to whether or not forex automated trading software would work for you, consider these three advantages running an auto forex enterprise holds over the alternative.

Signal Generation – Signal generation is a major bonus which comes with using forex automated trading software. This is the function of the program which uses complex mathematical algorithms to analyze the market's trends and uses the data it collects to predict where the market will go next. This allows you to trade ahead of the curve and use these tips to take advantages that other traders can't. You don't have to worry about human error in this case like you would if you relied forex analysts. Constant free updates to the program keep your predictions as precise as possible. If you always want to have the most precise information for your trading available, there is no substitute for auto trading software.

Safety Net – With their stop loss and take profit protocols, you'll never have to worry about one of your investments changing in the middle of the night and bottoming out with all of your savings with it. At the earliest indication that the market is about to turn against your favor, the program trades off and minimizes your losses. Conversely, it also trades to maximize your profits, as well, in cooperation with its signal generation. This gives you peace of mind at knowing you're being taken care of.

Around the Clock – I briefly touched on this, but as the forex market keeps tireless hours, it's imperative that you have the ability to stay up with it. It's just common sense that if you want to be able to take advantage of a great trade, you've got to be there to do it. At least that's how it used to be. Forex automated trading software affords you the opportunity to run a successful forex auto enterprise which will reliably and steadily build you wealth, but also have a life outside of your trades.

If you're interested in reliable and guaranteed income, consider forex automated trading software by visiting http://www.forexautotradingreviewed.com for reviews and immediate test trials of the leading and most accurate forex systems and signal generators.

everything exist in internet?

Internet is watched over by agreement bi- or multilateral and spesification teknikal (protocol explain about data transfer between series). these protocols is formed based on internet discussion engineering task force (ietf), opened to general.

This body takes document that identified as rfc (request for comments). some of rfc made standard internet (standards internet), by internet architecture body (internet architecture board - iab).

Internet protocols often used like, ip, tcp, udp, dns, ppp, slip, icmp, pop3, imap, smtp, http, https, ssh, telnet, ftp, ldap, and ssl.

Several popular services at internet that uses protocol above, electronic email/mail, usenet, newsgroup, file partnerships (file sharing), www (world wide web), gopher, session access (session access), wais, finger, irc, mud, and mush. between all this, electronic email/mail and world wide web more often used, and more many servis that built based on it, like milis (mailing
list) and weblog. internet makes existence servis kini (real-time service), like radio web, and webcast, can be accessinged in all the world. besides pass internet is maked to consolidations directly between two users or more pass instant message sender program likes camfrog, pidgin (gaim), trilian, kopete, yahoo! messenger, msn messenger and windows live messenger.

Several servis popular internet based on closed system ? (proprietary system), like irc, icq, aim, cddb, and gnutella.

what got and profit from internet?

Big internet user total and more bloom, realize internet culture. has also big influence on science, and opinion world. with only use from search engine likes google, user in all has easy internet access on diverse information.

Compared with book and library, internet symbolizes spreads (decentralization) / erudition (knowledge) information and data according to extreme.

Also influence economy development. various previous sales transaction only can be done by tatap face (and a part very little pass post or telephone), now very easy and often done pass internet. transaction passes this internet is known by the name of e-commerce. Related to government, also trigger grow it execution transparency government passes e-government.

Country with best internet access belongs south korea (50% than has access broadband), and swed. found two internet access form general, that is dial-up, and broadband. in indonesia, like where does internet access and penetration pc still also low another around 42% from internet access passes facilities public internet aksss like warnet, cybercafe, hotspot etc. another general place often worn for internet access at campus and office.

we have e-book pilot to build warnet simple from begin, capital need calculation, luck lost it until, installing manner warnet you up to functioned with sofware supporter to make a warnet.


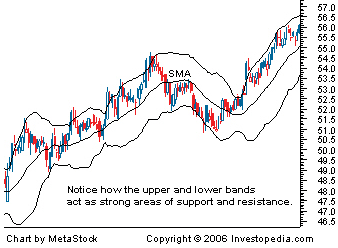
In addition to identifying relative price levels and volatility, Bollinger Bands can be combined with price action and other indicators to generate signals and foreshadow significant moves.

Double bottom Buy: A Double Bottom Buy signal is given when prices penetrate the lower band and remain above the lower band after a subsequent low forms. Either low can be higher or lower than the other. The important thing is that the second low remains above the lower band. The bullish setup is confirmed when the price moves above the middle band, or simple moving average.

AT&T Corp. (T) BB example chart from StockCharts.com

AT&T (T) provides an example of a Double Bottom Buy signal. The stock penetrated the lower band in late September (red arrow) and then held above on the subsequent test in October. The October breakout above the middle band (green circle) provided the bullish confirmation.

Double Top Sell: A Double Top Sell signal is given when prices peak above the upper band and a subsequent peak fails to break above the upper band. The bearish setup is confirmed when prices decline below the middle band.

Sharp price changes can occur after the bands have tightened and volatility is low. In this instance, Bollinger Bands do not give any hint as to the future direction of prices. Direction must be determined using other indicators and aspects of technical analysis. Many securities go through periods of high volatility followed by periods of low volatility. Using Bollinger Bands, these periods can be easily identified with a visual assessment. Tight bands indicate low volatility and wide bands indicate high volatility. Volatility can be important for options players because options prices will be cheaper when volatility is low.

A band plotted two standard deviations away from a simple moving average.


In this example of Bollinger bands, the price of the stock is banded by an upper and lower band along with a 21-day simple moving average.

Because standard deviation is a measure of volatility, Bollinger bands adjust themselves to the market conditions. When the markets become more volatile, the bands widen (move further away from the average), and during less volatile periods, the bands contract (move closer to the average). The tightening of the bands is often used by technical traders as an early indication that the volatility is about to increase sharply.

This is one of the most popular technical analysis techniques. The closer the prices move to the upper band, the more overbought the market, and the closer the prices move to the lower band, the more oversold the market.

Bollinger Bands are a technical trading tool created by John Bollinger in the early 1980s. They arose from the need for adaptive trading bands and the observation that volatility was dynamic, not static as was widely believed at the time.

The purpose of Bollinger Bands is to provide a relative definition of high and low. By definition prices are high at the upper band and low at the lower band. This definition can aid in rigorous pattern recognition and is useful in comparing price action to the action of indicators to arrive at systematic trading decisions.

Bollinger Bands consist of a set of three curves drawn in relation to securities prices. The middle band is a measure of the intermediate-term trend, usually a simple moving average, that serves as the base for the upper and lower bands. The interval between the upper and lower bands and the middle band is determined by volatility, typically the standard deviation of the same data that were used for the average. The default parameters, 20 periods and two standard deviations, may be adjusted to suit your purposes:

Middle Bollinger Band = 20-period simple moving average
Upper Bollinger Band = Middle Bollinger Band + 2 * 20-period standard deviation
Lower Bollinger Band = Middle Bollinger Band - 2 * 20-period standard deviation

Two important tools are derived from the Bollinger Bands: BandWidth, a relative measure of the width of the bands, and %b, a measure of where the last price is in relation to the bands.

BandWidth = (Upper Bollinger Band - Lower Bollinger Band) / Middle Bollinger Band
%b = (Last - Lower Bollinger Band) / (Upper Bollinger Band - Lower Bollinger Band)

BandWidth is most often used to quantify The Squeeze, a volatility-based trading opportunity. %b is used to clarify trading patterns and as an input for trading systems.

Unique visitor


A unique visitor is a statistic describing a unit of traffic to a Web site, counting each visitor only once in the time frame of the report. This statistic is relevant to site publishers and advertisers as a measure of a site's true audience size, equivalent to the term "Reach" used in other media.

The number of Total Visitors to a site divided by Unique Visitors results in the derived statistic "Average Sessions Per Unique Visitor" which tells a publisher how many times each Unique Visitor came to their site on average in the time frame of the report. Average Sessions Per Unique Visitor is equivalent to "Frequency" used in other media.

The Unique Visitors statistic is most accurately measured in two ways with current technology:

  1. by requiring all Visitors to log-in to the site, thereby capturing the identity of each Visitor on each visit, or
  2. by placing a cookie on each Visitor's computer, writing the cookie ID to a database, and checking for the cookie on each Visitor's computer each time they visit.

Some log file analysis software products calculate a proxy for Unique Visitors by counting the number of visitors from unique IP addresses. This statistic is a poor measure as it is distorted by two main factors:

  1. Many consumers access the internet from networks that allow them to share a single IP address, which results in the IP address proxy undercounting Unique Visitors. Tracking the visitor's UserAgent (browser identification information) in addition to the IP address can help mitigate this, but many of the users that share a single IP address may also use the same browser.
  2. There are also Internet Service Providers (ISP), such as AOL and cable modem providers, that use Dynamic Host Configuration Protocol (DHCP) which can provide their customers with a different IP addresses for each request they make from a site, thereby making one visitor look like many, thereby causing the IP address proxy to overcount Unique Users. However, most only do this after a timeout period when they run out of available IP addresses.

Many log file analysis products also use a proxy for Unique Visitors in which they count multiple visitors from the same IP Address if they don't visit the site within the same 30-minute window. This statistic results in a higher number than counting unique IP addresses, but is not equivalent to Unique Visitors as there is no guarantee that a visitor from the same IP Address outside the 30-minute window is a different visitor than a previous Visitor within the window.

Criticism

The science of tracking Internet usage is still far from perfect. Marketers rely heavily on comScore and the other major Web-measurement company, Nielsen Online, when trying to decide how to spend their online ad dollars. Advertisers study their data - including a Web site's total visitors or page views and time spent on the site -- to try to determine which sites are popular among particular demographic groups or in certain topic areas, such as news or sports. They typically compare those data with a Web site's own figures. Both Web-measurement companies have gaps in their research. Because they use panels of Web users to gather data and then extrapolate, the results are estimates. And both companies lack the capacity to measure total international audiences. The companies are trying to address those shortcomings by looking for ways to increase the size and depth of their panels, investing in technology and expanding overseas. Nielsen Online, which is owned by the audience-measurement firm Nielsen, also is trying to combine its Web research with usage data from other media, such as mobile-phone and television measures. To complicate matters, disparities between comScore and Nielsen data are common, as the two companies use different methodologies to measure their audience panels.

Source From : wikipedia.org


HP Pavilion S3420F Slimline Desktop PC (AMD Athlon 64 X 2 Dual Core 5400+ Processor, 3 GB RAM, 500 GB Hard Drive, DVD Drive, Vista Premium)


Product Description

Get all the power and functionality of a fully loaded desktop PC in a space-saving design that's one-third the size of a conventional tower. HP Pavilion PC's feature the exclusive Pocket Media Drive bay that allows you to add instant storage. The Pocket Media Drive also works with any USB enabled PC. The front-panel 15-in-1 memory card reader makes it easy to transfer photos and files to and from your digital camera and other peripheral devices. The SuperMulti DVD burner with LightScribe technology lets you create custom, silkscreen-quality labels and artwork directly onto LightScribe-enabled CD and DVD discs. You have Internet access anywhere in your home with the built-in 802.11G wireless. The built-in TV tuner and personal video recorder (PVR) let you watch, pause, rewind, and record live television - with no monthly fee. The free online Electronic Program Guide (EPG) lets you review the TV schedule and choose a single episode or an entire series. Windows Vista Service Pack 1 provides the latest operating system improvements and enhancements from Microsoft. NVIDIA GeForce 6150 SE with 128MB dedicated with up to 1343MB Shared Graphics Memory NTSC TV tuner over-the-air ATSC high-definition television tuner with PVR LightScribe SuperMulti DVD+-R/RW with Double Layer High Definition Audio, 6 speaker configurable Built-in 802.11B/G Wireless 10/100BaseT Ethernet LAN 15-in-1 card reader Front ports - 2 x USB, Headphone Back ports - 4 x USB, IEEE 1394, 2 x PS2 ports (keyboard, mouse), Digital Audio Out, Microphone/Line-in/Line-out, RJ-45 (LAN), RJ-11 (Modem), VGA Expansion slots - 1 x PCI (occupied), 1 x PCI Express x16 (available) Drive bays - 1 x external 5.25 (occupied), 1 x external 3.5 (occupied), 1 x internal 3.5 (occupied) Monitor is not included.

Product Details

  • Amazon Sales Rank: #71 in Personal Computers
  • Color: Black/ Silver
  • Brand: Hewlett-Packard
  • Model: S3420F
  • Dimensions: 8.50" h x 13.89" w x 4.21" l, 19.65 pounds
  • CPU: AMD Athlon 64 X2 2.8 GHz
  • Memory: 3000MB DDR2 SDRAM
  • Hard Disk: 500GB
  • Processors: 2

Features

  • Powerful, slim PC that's one-third the size of a traditional PC tower with sleek, silver-and-black chassis
  • 2.8 GHz AMD Athlon 64 X2 5400+ dual-core processor, 500 GB hard drive, 3 GB RAM (4 GB max), 16x LightScribe DVD drive
  • NTSC/ATSC TV tuners, 54g Wi-Fi LAN (802.11b/g), 10/100 Ethernet, Nvidia GeForce Go 6150 video card with up to 1343 MB of available memory
  • Connectivity: 6 USB, 1 FireWire, 1 VGA, 1 line-out, 1 microphone/line-in, 1 S/PDIF out, 2 PS/2, 15-in-1 memory card reader
  • Pre-installed with Windows Vista Home Premium (Service Pack 1); includes wired keyboard/mouse


Ways To Boost Your Affiliate Commissions Overnight

· The ideal world of affiliate marketing does not require having your won website, dealing with customers, refunds, product development and maintenance. This is one of the easiest ways of launching into an online business and earning more profit. Assuming you are already into an affiliate program, what would be the next thing you would want to do? Double, or even triple, your commissions, right? How do you do that.
Here are some powerful tips on how to boost your affiliate program commissions overnight.

  • Know the best program and products to promote. Obviously, you would want to promote a program that will enable you to achieve the greatest profits in the shortest possible time.
  • There are several factors to consider in selecting such a program. Choose the ones that have a generous commission structure. Have products that fit in with your target audience. And that has a solid track record of paying their affiliate easily and on time. If you cannot seem to increase your investments, dump that program and keep looking for better ones.
  • There are thousands of affiliate programs online which gives you the reason to be picky. You may want to select the best to avoid losing your advertising dollars.
  • Write free reports or short ebooks to distribute from your site. There is a great possibility that you are competing with other affiliates that are promoting the same program. If you start writing short report related to the product you are promoting, you will be able to distinguish yourself from the other affiliates.
  • In the reports, provide some valuable information for free. If possible, add some recommendations about the products. With ebooks, you get credibility. Customers will see that in you and they will be enticed to try out what you are offering.
  • Collect and save the email addresses of those who download your free ebooks. It is a known fact that people do not make a purchase on the first solicitation. You may want to send out your message more than six times to make a sale.
  • This is the simple reason why you should collect the contact information of those who downloaded your reports and ebooks. You can make follow-ups on these contacts to remind them to make a purchase from you.
  • Get the contact information of a prospect before sending them to the vendor's website. Keep in mind that you are providing free advertisement for the product owners. You get paid only when you make a sale. If you send prospects directly to the vendors, chances are they would be lost to you forever.
  • But when you get their names, you can always send other marketing messages to them to be able to earn an ongoing commission instead of a one-time sale only.
  • Publish an online newsletter or Ezine. It is always best to recommend a product to someone you know than to sell to a stranger. This is the purpose behind publishing your own newsletter. This also allows you to develop a relationship based on trust with your subscribers.
  • This strategy is a delicate balance between providing useful information with a sales pitch. If you continue to write informative editorials you will be able to build a sense of reciprocity in your readers that may lead them to support you by buying your products.
  • Ask for higher than normal commission from merchants. If you are already successful with a particular promotion, you should try and approach the merchant and negotiate a percentage commission for your sales.
  • If the merchant is smart, he or she will likely grant your request rather than lose a valuable asset in you. Keep in mind that you are a zero-risk investment to your merchant; so do not be shy about requesting for addition in your commissions. Just try to be reasonable about it.
  • Write strong pay Per Click ads. PPC search engine is the most effective means of advertising online. As an affiliate, you can make a small income just by managing PPC campaigns such as Google AdWords and Overture. Then you should try and monitor them to see which ads are more effective and which ones to dispose of.
Try out these strategies and see the difference it can make to your commission checks in the shortest of time.


Beware of These Email Bank Scams


One of the most popular identity theft scams is to send spam to potential victims advising them that they need to visit a financial service's Web site to update or confirm their personal information.

Naturally, the URL in the scam email sends the victim to a phony Web site, and when the victim has divulged his or her personal and credit card information, the scammer can make off with lots of cash -- and perhaps the victim's identity as well.

Later in this issue you'll read about how scammers are targeting Best Buy and eBay users with similar schemes, but this section describes the latest forged emails purporting to be from banks. Don't be fooled...

1. Citibank c2it

The scam: You're a user of the c2it money transfer service from Citibank, and you receive an email saying that your account has been placed on hold for security measure maintenance. You're asked to visit a Web site to confirm your account information.

Tip-offs that it's a scam: Not many. It's a professional looking email, with a Citibank logo. One tip is that the return header is from a Hotmail address. Another tip is that, if you click the submit button, the link takes the user to a site owned by the Harvard-Smithsonian Center for Astrophysics.

2. Bank of America

The scam: You're a customer of the Bank of America, and you receive an email from custommersupport@bankofamerica.com with a subject line "Security Server Update." It informs you that because of a 'technical update' you need to reactivate your account by visiting a URL and re-entering your personal information.

Tip-offs that it's a scam: It contains many spelling and grammar errors. As well, the URL leads to a broken Web site (it has been taken down).

3. First Union Bank

The scam: You're a customer of First Union, and you receive an email from bankaccount@firstunion.com telling you that First Union has lost your online banking user name and password. The email tells you to go to a Web site and re-enter the information.

This one is particularly nasty, because simply visiting the Web site downloads a 'backdoor' Trojan program to your computer that can give scammers the ability to control your computer remotely.

Tip-offs that it's a scam: The URL given is a firstunion.com address. Wachovia.com is now the Internet address for both First Union and Wachovia customers.

How can you avoid getting scammed this way?

  1. First, be calm. Most of us receiving an email like this might be alarmed that our account was frozen or our credit card information had been stolen. But by being calm, you can make sure you assess the situation rationally instead of just following the instructions in the email.
  2. Recognize that legitimate companies never request this information via email. When you get this kind of email, realize the chances are excellent that it's a scam.
  3. Go to the official Web site for the financial institution directly by typing its URL in the address bar of a Web browser, *not* by clicking any hyperlink in an email. If there is a real problem, it will most likely be on the home page.
  4. If you're still uncertain, email or call the company's customer support department, and ask them to confirm the email's authenticity. They will then tell you what to do next.

Moving Average Settings

Once a security has been deemed to have enough characteristics of trend, the next task will be to select the number of moving average periods and type of moving average. The number of periods used in a moving average will vary according to the security's volatility, trendiness and personal preferences. The more volatility there is, the more smoothing that will be required and hence the longer the moving average. Stocks that do not exhibit strong characteristics of trend may also require longer moving averages. There is no one set length, but some of the more popular lengths include 21, 50, 89, 150 and 200 days as well as 10, 30 and 40 weeks. Short-term traders may look for evidence of 2-3 week trends with a 21-day moving average, while longer-term investors may look for evidence of 3-4 month trends with a 40-week moving average. Trial and error is usually the best means for finding the best length. Examine how the moving average fits with the price data. If there are too many breaks, lengthen the moving average to decrease its sensitivity. If the moving average is slow to react, shorten the moving average to increase its sensitivity. In addition, you may want to try using both simple and exponential moving averages. Exponential moving averages are usually best for short-term situations that require a responsive moving average. Simple moving averages work well for longer-term situations that do not require a lot of sensitivity.

Uses for Moving Averages

There are many uses for moving averages, but three basic uses stand out:

  • Trend identification/confirmation
  • Support and Resistance level identification/confirmation
  • Trading Systems

Trend Identification/Confirmation

There are three ways to identify the direction of the trend with moving averages: direction, location and crossovers.

The first trend identification technique uses the direction of the moving average to determine the trend. If the moving average is rising, the trend is considered up. If the moving average is declining, the trend is considered down. The direction of a moving average can be determined simply by looking at a plot of the moving average or by applying an indicator to the moving average. In either case, we would not want to act on every subtle change, but rather look at general directional movement and changes.

Walt Disney Co. (DIS) MA example chart from StockCharts.com

In the case of Disney (DIS), a 100-day exponential moving average (EMA) has been used to determine the trend. We do not want to act on every little change in the moving average, but rather significant upturns and downturns. This is not a scientific study, but a number of significant turning points can be spotted just based on visual observation (red circles). A few good signals were rendered, but also a few whipsaws and late signals. Much of the performance would depend on your entry and exit points. The length of the moving average influences the number of signals and their timeliness. Moving averages are lagging indicators. Therefore, the longer the moving average is, the further behind the price movement it will be. For quicker signals, a 50-day EMA could have been used.

The second technique for trend identification is price location. The location of the price relative to the moving average can be used to determine the basic trend. If the price is above the moving average, the trend is considered up. If the price is below the moving average, the trend is considered down.

Cisco Systems, Inc. (CSCO) MA example chart from StockCharts.com

This example is pretty straightforward. The long-term for Cisco (CSCO) is determined by the location of the stock relative to its 100-day SMA. When CSCO is above its 100-day SMA, the trend is considered bullish. When the stock is below the 100-day SMA, the trend is considered bearish. Buy and sell signals are generated by crosses above and below the moving average. There was a brief sell signal generated in Aug-99 and a false buy signal in July-00. Both of these signals occurred when Cisco's trend began to weaken. For the most part though, this simple method would have kept an investor in throughout most of the bull move.

The third technique for trend identification is based on the location of the shorter moving average relative to the longer moving average. If the shorter moving average is above the longer moving average, the trend is considered up. If the shorter moving average is below the longer moving average, the trend is considered down.

Inter-Tel, Inc. (INTL) MA example chart from StockCharts.com

For Inter-Tel (INTL), a 30/100 moving average crossover was used to determine the trend. When the 30-day moving average moves above the 100-day moving average, the trend is considered bullish. When the 30-day moving average declines below the 100-day moving average, the trend is considered bearish. A plot of the 30/100 differential is plotted below the price chart by using the Percentage Price Oscillator (PPO) set to (30,100,1). When the differential is positive the trend is considered up – when it is negative the trend is considered down. As with all trend-following systems, the signals work well when the stock develops a strong trend, but are ineffective when the stock is in a trading range. Also notice that the signals tend to be late and after the move has begun. Again, trend following indicators are best for identification and following, not predicting.

Support and Resistance Levels

Another use of moving averages is to identify support and resistance levels. This is usually accomplished with one moving average and is based on historical precedent. As with trend identification, support and resistance level identification through moving averages works best in trending markets.

Sun Microsystems, Inc. (SUNW) MA example chart from StockCharts.com

After breaking out of a trading range, Sun Microsystems (SUNW)[Sunw] successfully tested moving average support in late July and early August. Also notice that the June resistance breakout near 18 turned into support. Therefore, the moving average acted as a confirmation of resistance-turned-support. After this first test, the 50-day moving average went on to 4 more successful support tests over the next several months. A break of support from the 50-day moving average would serve as a warning that the stock may move into a trading range or may be about to change the direction of the trend. Such a break occurred in Apr-00 and the 50-day SMA turned into resistance later that month. When the stock broke above the 50-day SMA in early Jun-00, it returned to a support level until the Oct-00 break. In Oct-00, the 50-day SMA became a resistance level and that held for many months.

In order to reduce the lag in simple moving averages, technicians often use exponential moving averages (also called exponentially weighted moving averages). EMA's reduce the lag by applying more weight to recent prices relative to older prices. The weighting applied to the most recent price depends on the specified period of the moving average. The shorter the EMA's period, the more weight that will be applied to the most recent price. For example: a 10-period exponential moving average weighs the most recent price 18.18% while a 20-period EMA weighs the most recent price 9.52%. As we'll see, the calculating and EMA is much harder than calculating an SMA. The important thing to remember is that the exponential moving average puts more weight on recent prices. As such, it will react quicker to recent price changes than a simple moving average. Here's the calculation formula.

Exponential Moving Average Calculation

Exponential Moving Averages can be specified in two ways - as a percent-based EMA or as a period-based EMA. A percent-based EMA has a percentage as it's single parameter while a period-based EMA has a parameter that represents the duration of the EMA.

The formula for an exponential moving average is:

EMA(current) = ( (Price(current) - EMA(prev) ) x Multiplier) + EMA(prev)

For a percentage-based EMA, "Multiplier" is equal to the EMA's specified percentage. For a period-based EMA, "Multiplier" is equal to 2 / (1 + N) where N is the specified number of periods.

For example, a 10-period EMA's Multiplier is calculated like this:

(2 / (Time periods + 1) ) = (2 / (10 + 1) ) = 0.1818 (18.18%)

This means that a 10-period EMA is equivalent to an 18.18% EMA.

Note: StockCharts.com only support period-based EMA's.

Below is a table with the results of an exponential moving average calculation for Eastman Kodak. For the first period's exponential moving average, the simple moving average was used as the previous period's exponential moving average (yellow highlight for the 10th period). From period 11 onward, the previous period's EMA was used. The calculation in period 11 breaks down as follows:

(C - P) = (57.15 - 59.439) = -2.289

(C - P) x K = -2.289 x .181818 = -0.4162

( (C - P) x K) + P = -0.4162 + 59.439 = 59.023

table

*The 10-period simple moving average is used for the first calculation only. After that the previous period's EMA is used.

(Download this table as an Excel spreadsheet)

Note that, in theory, every previous closing price in the data set is used in the calculation of each EMA that makes up the EMA line. While the impact of older data points diminishes over time, it never fully disappears. This is true regardless of the EMA's specified period. The effects of older data diminish rapidly for shorter EMA's. than for longer ones but, again, they never completely disappear.

Simple Versus Exponential

From afar, it would appear that the difference between an exponential moving average and a simple moving average is minimal. For this example, which uses only 20 trading days, the difference is minimal, but a difference nonetheless. The exponential moving average is consistently closer to the actual price. On average, the EMA is 3/8 of a point closer to the actual price than the SMA.

From day 10 to day 20, the EMA was closer to the price than the SMA 8 out of 11 times. The average absolute difference between the exponential moving average and the current price was 1.52 and the simple moving average had an average absolute difference of 1.69. This means that on average, the exponential moving average was 1.52 point above or below the current price and the simple moving average was 1.69 points above or below the current price.

When Kodak stopped falling and started to trade flat, the SMA kept on declining. During this period, the SMA was closer to the actual price than the EMA. The EMA began to level out with the actual price, and remain further away. This was because the actual price started to level out. Because of its lag, the SMA continued to decline and nearly touched the actual price on 13-Dec.

International Business Machines (IBM) MA example chart from StockCharts.com

A comparison of a 50-day EMA and a 50-day SMA for IBM also shows that the EMA picks up on the trend quicker than the SMA. The blue arrows mark points when the stock started a strong trend. By giving more weight to recent prices, the EMA reacted quicker than the SMA and remained closer to the actual price. The gray circle shows when the trend began to slow and a trading range developed. When the change from trend to trading began, the SMA was closer to the price. As the trading range continued into 2001, both moving averages converged. In early 2001, CPQ started to trend up and the EMA was quicker to pick up on the recent price change and remain closer to the price.

Which is better?

Which moving average you use will depend on your trading and investing style and preferences. The simple moving average obviously has a lag, but the exponential moving average may be prone to quicker breaks. Some traders prefer to use exponential moving averages for shorter time periods to capture changes quicker. Some investors prefer simple moving averages over long time periods to identify long-term trend changes. In addition, much will depend on the individual security in question. A 50-day SMA might work great for identifying support levels in the NASDAQ, but a 100-day EMA may work better for the Dow Transports. Moving average type and length of time will depend greatly on the individual security and how it has reacted in the past.

The initial thought for some is that greater sensitivity and quicker signals are bound to be beneficial. This is not always true and brings up a great dilemma for the technical analyst: the trade off between sensitivity and reliability. The more sensitive an indicator is, the more signals that will be given. These signals may prove timely, but with increased sensitivity comes an increase in false signals. The less sensitive an indicator is, the fewer signals that will be given. However, less sensitivity leads to fewer and more reliable signals. Sometimes these signals can be late as well.

For moving averages, the same dilemma applies. Shorter moving averages will be more sensitive and generate more signals. The EMA, which is generally more sensitive than the SMA, will also be likely to generate more signals. However, there will also be an increase in the number of false signals and whipsaws. Longer moving averages will move slower and generate fewer signals. These signals will likely prove more reliable, but they also may come late. Each investor or trader should experiment with different moving average lengths and types to examine the trade-off between sensitivity and signal reliability.

Introduction

Moving averages are one of the most popular and easy to use tools available to the technical analyst. They smooth a data series and make it easier to spot trends, something that is especially helpful in volatile markets. They also form the building blocks for many other technical indicators and overlays.

Sun Microsystems, Inc. (SUNW) MA 50/100 chart example from StockCharts.com

The two most popular types of moving averages are the Simple Moving Average (SMA) and the Exponential Moving Average (EMA). They are described in more detail below.

Simple Moving Average (SMA)

(Click here for a live example of a Simple Moving Average)

A simple moving average is formed by computing the average (mean) price of a security over a specified number of periods. While it is possible to create moving averages from the Open, the High, and the Low data points, most moving averages are created using the closing price. For example: a 5-day simple moving average is calculated by adding the closing prices for the last 5 days and dividing the total by 5.

10+ 11 + 12 + 13 + 14 = 60

(60 / 5) = 12

The calculation is repeated for each price bar on the chart. The averages are then joined to form a smooth curving line - the moving average line. Continuing our example, if the next closing price in the average is 15, then this new period would be added and the oldest day, which is 10, would be dropped. The new 5-day simple moving average would be calculated as follows:

11 + 12 + 13 + 14 +15 = 65

(65 / 5) = 13

Over the last 2 days, the SMA moved from 12 to 13. As new days are added, the old days will be subtracted and the moving average will continue to move over time.

In the example above, using closing prices from Eastman Kodak (EK), day 10 is the first day possible to calculate a 10-day simple moving average. As the calculation continues, the newest day is added and the oldest day is subtracted. The 10-day SMA for day 11 is calculated by adding the prices of day 2 through day 11 and dividing by 10. The averaging process then moves on to the next day where the 10-day SMA for day 12 is calculated by adding the prices of day 3 through day 12 and dividing by 10.

The chart above is a plot that contains the data sequence in the table. The simple moving average begins on day 10 and continues.

This simple illustration highlights the fact that all moving averages are lagging indicators and will always be "behind" the price. The price of EK is trending down, but the simple moving average, which is based on the previous 10 days of data, remains above the price. If the price were rising, the SMA would most likely be below. Because moving averages are lagging indicators, they fit in the category of trend following indicators. When prices are trending, moving averages work well. However, when prices are not trending, moving averages can give misleading signals.

Forex trading signal

Tuesday, Agustus 5, 2008

TF D1


------------------------------------------------------------------------------------------------

EURUSD, Daily

UTD 1.5767 ... 1.5699
LTD 1.5468 ... 1.5513

UTD line (1.5631)
Target 1 = 1.5776 (145 Pts) probably break up targets 42 %
LTD Line (1.5516)
Target 1 = 1.4371 (545 Pts) probably break down target 66 %


------------------------------------------------------------------------------------------------

GBPUSD, Daily

UTD 1.9966 .... 1.9926
LTD 1.9643 .... 1.9740

UTD line ( 1.9866 )
Target 1 = 2.0209 ( 343 Pts) probably break up targets 37 %
LTD Line ( 1.9761 )
Target 1 = 1.9276 ( 475 Pts) probably break down target 72 %

-------------------------------------------------------------------------------------------------

GBPJPY, Daily

UTD 214.87 ... 214.56
LTD 211.58 ... 211.98

UTD line ( 214.25 )
Target 1 = 217.94 ( 369 Pts) probably break up targets 55 %
LTD Line ( 212.14 )
Target 1 = 208.93 ( 321 Pts) probably break down target 66%

-------------------------------------------------------------------------------------------------

USDJPY, Daily

UTD 108.40 ... 108.36
LTD 106.57 ... 107.28

UTD line ( 108.36 )
Target 1 = 112.97 (462 Pts) probably break up targets 48 %
LTD Line (107.56)
Target 1 = 106.34 (122 Pts) probably break down target 53 %

-------------------------------------------------------------------------------------------------

The Trading signal for use in long terms condition in daily indicators

-------------------------------------------------------------------------------------------------

WARNING !!!

Forex trading involves a high level of risk and may not be suitable for all investors. There is a possibility that you could lose some or all of your investment and therefore you should not invest money that you cannot afford to lose.

-------------------------------------------------------------------------------------------------

Apa saja yang ada di Internet ?

Internet dijaga oleh perjanjian bi- atau multilateral dan spesifikasi teknikal (protokol yang
menerangkan tentang perpindahan data antara rangkaian). Protokol-protokol ini dibentuk
berdasarkan perbincangan Internet Engineering Task Force (IETF), yang terbuka kepada
umum. Badan ini mengeluarkan dokumen yang dikenali sebagai RFC (Request for
Comments). Sebagian dari RFC dijadikan Standar Internet (Internet Standard), oleh
Badan Arsitektur Internet (Internet Architecture Board - IAB).
Protokol-protokol internet yang sering digunakan adalah seperti, IP, TCP, UDP, DNS,
PPP, SLIP, ICMP, POP3, IMAP, SMTP, HTTP, HTTPS, SSH, Telnet, FTP, LDAP, dan
SSL.

Beberapa layanan populer di internet yang menggunakan protokol di atas, ialah
email/surat elektronik, Usenet, Newsgroup, perkongsian file (File Sharing), WWW
(World Wide Web), Gopher, akses sesi (Session Access), WAIS, finger, IRC, MUD, dan
MUSH. Di antara semua ini, email/surat elektronik dan World Wide Web lebih kerap
digunakan, dan lebih banyak servis yang dibangun berdasarkannya, seperti milis (Mailing
List) dan Weblog. Internet memungkinkan adanya servis terkini (Real-time service),
seperti web radio, dan webcast, yang dapat diakses di seluruh dunia. Selain itu melalui
internet dimungkinkan untuk berkonikasi secara langsung antara dua pengguna atau lebih
melalui program pengirim pesan instan seperti Camfrog, Pidgin (Gaim), Trilian, Kopete,
Yahoo! Messenger, MSN Messenger dan Windows Live Messenger.

Beberapa servis Internet populer yang berdasarkan sistem Tertutup(?)(Proprietary
System), adalah seperti IRC, ICQ, AIM, CDDB, dan Gnutella.
Keuntungan dan kerugian apa yang diperoleh dari internet?
Jumlah pengguna Internet yang besar dan semakin berkembang, telah mewujudkan
budaya internet. Internet juga mempunyai pengaruh yang besar atas ilmu, dan pandangan
dunia. Dengan hanya berpandukan mesin pencari seperti Google, pengguna di seluruh
dunia mempunyai akses internet yang mudah atas bermacam-macam informasi.
Dibanding dengan buku dan perpustakaan, Internet melambangkan
penyebaran(decentralization) / pengetahuan (knowledge) informasi dan data secara
ekstrim.

Perkembangan Internet juga telah mempengaruhi perkembangan ekonomi. Berbagai
transaksi jual beli yang sebelumnya hanya bisa dilakukan dengan cara tatap muka (dan
sebagian sangat kecil melalui pos atau telepon), kini sangat mudah dan sering dilakukan
melalui Internet. Transaksi melalui Internet ini dikenal dengan nama e-commerce.
Terkait dengan pemerintahan, Internet juga memicu tumbuhnya transparansi pelaksanaan
pemerintahan melalui e-government.

Negara dengan akses internet yang terbaik termasuk Korea Selatan (50% daripada
penduduknya mempunyai akses jalurlebar - Broadband), dan Swedia. Terdapat dua
bentuk akses internet yang umum, yaitu dial-up, dan jalurlebar. Di Indonesia, seperti
negara berkembang dimana akses Internet dan penetrasi PC masih juga rendah lainnya
sekitar 42% dari akses Internet melalui fasilitas Public Internet aksss seperti warnet ,
cybercafe, hotspot dll. Tempat umum lainnya yang sering dipakai untuk akses internet
adalah di kampus dan dikantor.

Kami mempunyai e-book panduan untuk membangun warnet sederhana dari mulai, perhitungan kebutuhan modal, untung ruginya sampai, cara pemasangan warnet anda hingga berfungsi serta sofware-sofware pendukung untuk membuat sebuah warnet.

A hard disk drive (HDD), commonly referred to as a hard drive, hard disk, or fixed disk drive, is a non-volatile storage device which stores digitally encoded data on rapidly rotating platters with magnetic surfaces. Strictly speaking, "drive" refers to a device distinct from its medium, such as a tape drive and its tape, or a floppy disk drive and its floppy disk. Early HDDs had removable media; however, an HDD today is typically a sealed unit (except for a filtered vent hole to equalize air pressure) with fixed media.

Originally, the term "hard" was temporary slang, substituting "hard" for "rigid", before these drives had an established and universally-agreed-upon name. A HDD is a rigid-disk drive although it is rarely referred to as such. By way of comparison, a so-called "floppy" drive (more formally, a diskette drive) has a disc that is flexible. Some time ago, IBM's internal company term for a HDD was "file".

HDDs (introduced in 1956 as data storage for an IBM accounting computer) were originally developed for use with general purpose computers; see History of hard disk drives.

In the 21st century, applications for HDDs have expanded to include digital video recorders, digital audio players, personal digital assistants, digital cameras and video game consoles. In 2005 the first mobile phones to include HDDs were introduced by Samsung and Nokia. The need for large-scale, reliable storage, independent of a particular device, led to the introduction of configurations such as RAID arrays, network attached storage (NAS) systems and storage area network (SAN) systems that provide efficient and reliable access to large volumes of data. Note that although not immediately recognizable as a computer, all the aforementioned applications are actually embedded computing devices of some sort.

Technology

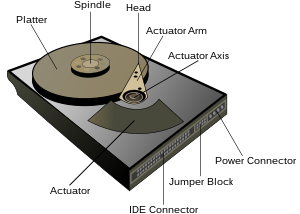
HDDs record data by magnetizing ferromagnetic material directionally, to represent either a 0 or a 1 binary digit. They read the data back by detecting the magnetization of the material. A typical HDD design consists of a spindle which holds one or more flat circular disks called platters, onto which the data are recorded. The platters are made from a non-magnetic material, usually aluminum alloy or glass, and are coated with a thin layer of magnetic material. Older disks used iron(III) oxide as the magnetic material, but current disks use a cobalt-based alloy.

A cross section of the magnetic surface in action. In this case the binary data is encoded using frequency modulation.

A cross section of the magnetic surface in action. In this case the binary data is encoded using frequency modulation.

The platters are spun at very high speeds (details follow). Information is written to a platter as it rotates past devices called read-and-write heads that operate very close (tens of nanometers in new drives) over the magnetic surface. The read-and-write head is used to detect and modify the magnetization of the material immediately under it. There is one head for each magnetic platter surface on the spindle, mounted on a common arm. An actuator arm (or access arm) moves the heads on an arc (roughly radially) across the platters as they spin, allowing each head to access almost the entire surface of the platter as it spins. The arm is moved using a voice coil actuator or (in older designs) a stepper motor. Stepper motors were outside the head-disk chamber, and preceded voice-coil drives. The latter, for a while, had a structure similar to that of a loudspeaker; the coil and heads moved in a straight line, along a radius of the platters. The present-day structure differs in several respects from that of the earlier voice-coil drives, but the same interaction between the coil and magnetic field still applies, and the term is still used.

Older drives read the data on the platter by sensing the rate of change of the magnetism in the head; these heads had small coils, and worked (in principle) much like magnetic-tape playback heads, although not in contact with the recording surface. As data density increased, read heads using magnetoresistance (MR) came into use; the electrical resistance of the head changed according to the strength of the magnetism from the platter. Later development made use of spintronics; in these heads, the magnetoresistive effect was much greater that in earlier types, and was dubbed "giant" magnetoresistance (GMR). This refers to the degree of effect, not the physical size, of the head — the heads themselves are extremely tiny, and are too small to be seen without a microscope. GMR read heads are now commonplace.

HD heads are kept from contacting the platter surface by the air that is extremely close to the platter; that air moves at, or close to, the platter speed. The record and playback head are mounted on a block called a slider, and the surface next to the platter is shaped to keep it just barely out of contact. It's a type of air bearing.

The magnetic surface of each platter is conceptually divided into many small sub-micrometre-sized magnetic regions, each of which is used to encode a single binary unit of information. In today's HDDs, each of these magnetic regions is composed of a few hundred magnetic grains. Each magnetic region forms a magnetic dipole which generates a highly localized magnetic field nearby. The write head magnetizes a region by generating a strong local magnetic field. Early HDDs used an electromagnet both to generate this field and to read the data by using electromagnetic induction. Later versions of inductive heads included metal in Gap (MIG) heads and thin film heads. In today's heads, the read and write elements are separate, but in close proximity, on the head portion of an actuator arm. The read element is typically magneto-resistive while the write element is typically thin-film inductive.

In modern drives, the small size of the magnetic regions creates the danger that their magnetic state might be lost because of thermal effects. To counter this, the platters are coated with two parallel magnetic layers, separated by a 3-atom-thick layer of the non-magnetic element ruthenium, and the two layers are magnetized in opposite orientation, thus reinforcing each other. Another technology used to overcome thermal effects to allow greater recording densities is perpendicular recording, first shipped in 2005, as of 2007 the technology was used in many HDDs.

See File System for how operating systems access data on HDDs and other storage devices.

Today's content rich Internet has been designed for fast line access speeds, but the reality is that most of us are stuck with "narrow" broadband and dialup connections which lead to a slow and disappointing online experience. Nitro has the answer.

Nitro is a revolutionary low cost solution for millions of Internet users around the world to dramatically increase the speed of their Internet connection.

Nitro is a global compression network accessed by a small (1MB) software download which is fast and easy to install. There's no need to change your ISP or phone line and no need to change your email settings or add new hardware.

NITRO Benefits


  • ·up to - 7x faster dialup, - 3x faster broadband - 6x faster wireles

  • Works with PC/MAC/Pocket PC and Symbion smartphones

  • Is portable - ideal for high speed mobile communications GPRS/GSM/CDMA

  • Save money on your wireless sessions and more than double your download limits if you are on a restricted plans

  • Works with your existing ISP and phone company/GPRS network - worldwide

  • Provides -up to 7x faster email including attachments

  • Is an inexpensive alternative to Broadband

  • Incorporates a free pop-up and banner add blocker (user defined)

  • Use Nitro when travelling - it's like taking your broadband with you.

  • Nitro has been developed to speed up any Internet connection including fixed line, wireless, satellite and helps to provide a fulfilling online experience without the frustration experienced by millions on slow speed connections.

How does NITRO work

Nitro's global compression network utilises patented technology and works by automatically compressing, optimising and streamlining the data flow across the Internet. The data stream is squashed down, much like a zip file, so more data can be brought across your bandwidth speed to your computer and You are now only seconds away from leaving the World Wide Wait behind you. Nitro will help make your Internet experience the pleasure it was designed to be.

How Nitro Works?

Nitro is a powerful, proven web and email acceleration solution that enables subscribers to easily gain access to the Internet over existing dial-up and wireless networks at up to five times the normal speed.

Nitro uses a patented proprietary data compression algorithm that reduces bandwidth requirements and increases the speed of Internet access. The Nitro solution has satisfied millions of customers need for speed on narrow band networks in most countries around the world.

The Nitro platform is comprised of two components in a Server/Client configuration.


Nitro Performance


Nitro provides unsurpassed acceleration of web content, FTP and emails, with speed increases up to 6X faster. Nitro combines patented proprietary data compression technology with optimization components that dramatically increase performance the more you use it. This technology gives subscribers an alternative product offering for dial-up or wireless users who either don't have access to high-speed cable or DSL services, or don't want to pay the higher prices charged for broadband services. Independent test results continuously confirm that Nitro is the fastest web accelerator on the market, and the same proven technology can accelerate access to critical business data for corporations..

Benchmark Test Results
Nitro’s Web Accelerator product beat out the competition in Internet BenchMark testing conducted by VeriTest.

Report findings:

  • Nitro's accessed first web pages more than 33 percent faster than the competition
  • Nitro improved download times by up to 5X
  • Nitro improved web page download times by an average of more than 2X
  • Nitro compressed text components of web pages by an average of 5.9X
  • Nitro compressed email messages and attachments more than 4.5X
    (for Microsoft Outlook and Microsoft Outlook Express)
  • Nitro blocked most pop-ups
  • At under 6MB, Nitro required significantly less hard disk space than competitive solutions


Affiliate marketing is an Internet-based marketing practice in which a business rewards one or more affiliates for each visitor or customer brought about by the affiliate's marketing efforts.

Affiliate marketing is also the name of the industry where a number of different types of companies and individuals are performing this form of Internet marketing, including affiliate networks, affiliate management companies, and in-house affiliate managers, specialized third party vendors, and various types of affiliates/publishers who promote the products and services of their partners.

Affiliate marketing overlaps with other Internet marketing methods to some degree, because affiliates often use regular advertising methods. Those methods include organic search engine optimization, paid search engine marketing, e-mail marketing and in some sense display advertising. On the other hand, affiliates sometimes use less orthodox techniques, such as publishing reviews of products or services offered by a partner.

Affiliate marketing — using one website to drive traffic to another — is a form of online marketing, which is frequently overlooked by advertisers. While search engines, e-mail, and website syndication capture much of the attention of online retailers, affiliate marketing carries a much lower profile. Still, affiliates continue to play

History

The beginning

The concept of revenue sharing — paying commission for referred business — predates affiliate marketing and the Internet. The translation of the revenue share principles to mainstream e-commerce happened almost four years after the World Wide Web was born in November 1994.

The consensus of marketers and adult industry insiders is that Cybererotica was either the first or among the early innovators in affiliate marketing with a cost per click program.[2]

During November 1994, CDNOW launched its BuyWeb program. With this program CDNOW was the first non-adult website to introduce the concept of an affiliate or associate program with its idea of click-through purchasing. CDNOW had the idea that music-oriented websites could review or list albums on their pages that their visitors may be interested in purchasing. These websites could also offer a link that would take the visitor directly to CDNOW to purchase the albums. The idea for remote purchasing originally arose because of conversations with music label Geffen Records in the fall of 1994. The management at Geffen wanted to sell its artists' CDs directly from its website, but did not want to implement this capability itself. Geffen Records asked CDNOW if it could design a program where CDNOW would handle the order fulfillment. Geffen Records realized that CDNOW could link directly from the artist on its website to Geffen's website, bypassing the CDNOW home page and going directly to an artist's music page.

Amazon.com (Amazon) launched its associate program in July 1996. Amazon associates could place banner or text links on their site for individual books, or link directly to the Amazon home page.

When visitors clicked from the associate's website through to Amazon and purchased a book, the associate received a commission. Amazon was not the first merchant to offer an affiliate program, but its program was the first to become widely-known and serve as a model for subsequent programs.

In February 2000, Amazon announced that it had been granted a patent (6,029,141) on all the essential components of an affiliate program. The patent application was submitted in June 1997, which predates most affiliate programs, but not PC Flowers & Gifts.com (October 1994), AutoWeb.com (October 1995), Kbkids.com/BrainPlay.com (January 1996), EPage (April 1996), and several others.

Historic development


Affiliate marketing has grown quickly since its inception. The e-commerce website, viewed as a marketing toy in the early days of the Internet, became an integrated part of the overall business plan and in some cases grew to a bigger business than the existing offline business. According to one report, the total sales amount generated through affiliate networks in 2006 was £2.16 billion in the UK alone. The estimates were £1.35 billion in sales in 2005. MarketingSherpa's research team estimated that, in 2006, affiliates worldwide earned US$6.5 billion in bounty and commissions from a variety of sources in retail, personal finance, gaming and gambling, travel, telecom, education, publishing, and forms of lead generation other than contextual advertising programs such as Google AdSense.

Currently the most active sectors for affiliate marketing are the adult, gambling, and retail sectors. The three sectors expected to experience the greatest growth are the mobile phone, finance, and travel sectors. Soon after these sectors came the entertainment (particularly gaming) and Internet-related services (particularly broadband) sectors. Also several of the affiliate solution providers expect to see increased interest from business-to-business marketers and advertisers in using affiliate marketing as part of their mix. Of course, this is constantly subject to change.

Country Visittor

 
COMPUTER AND INTERNET CONSULTANT (c) 2008 ~ 2009 e-consult